Allow Google Analytics to measure how I use the site to enhance functionality and service.

Allows us to show personalized advertisements based on your browsing behavior.

Share my activity data with cookies for targeted advertising.

Customize my ad experience by allowing cookies to personalize the ads I see.
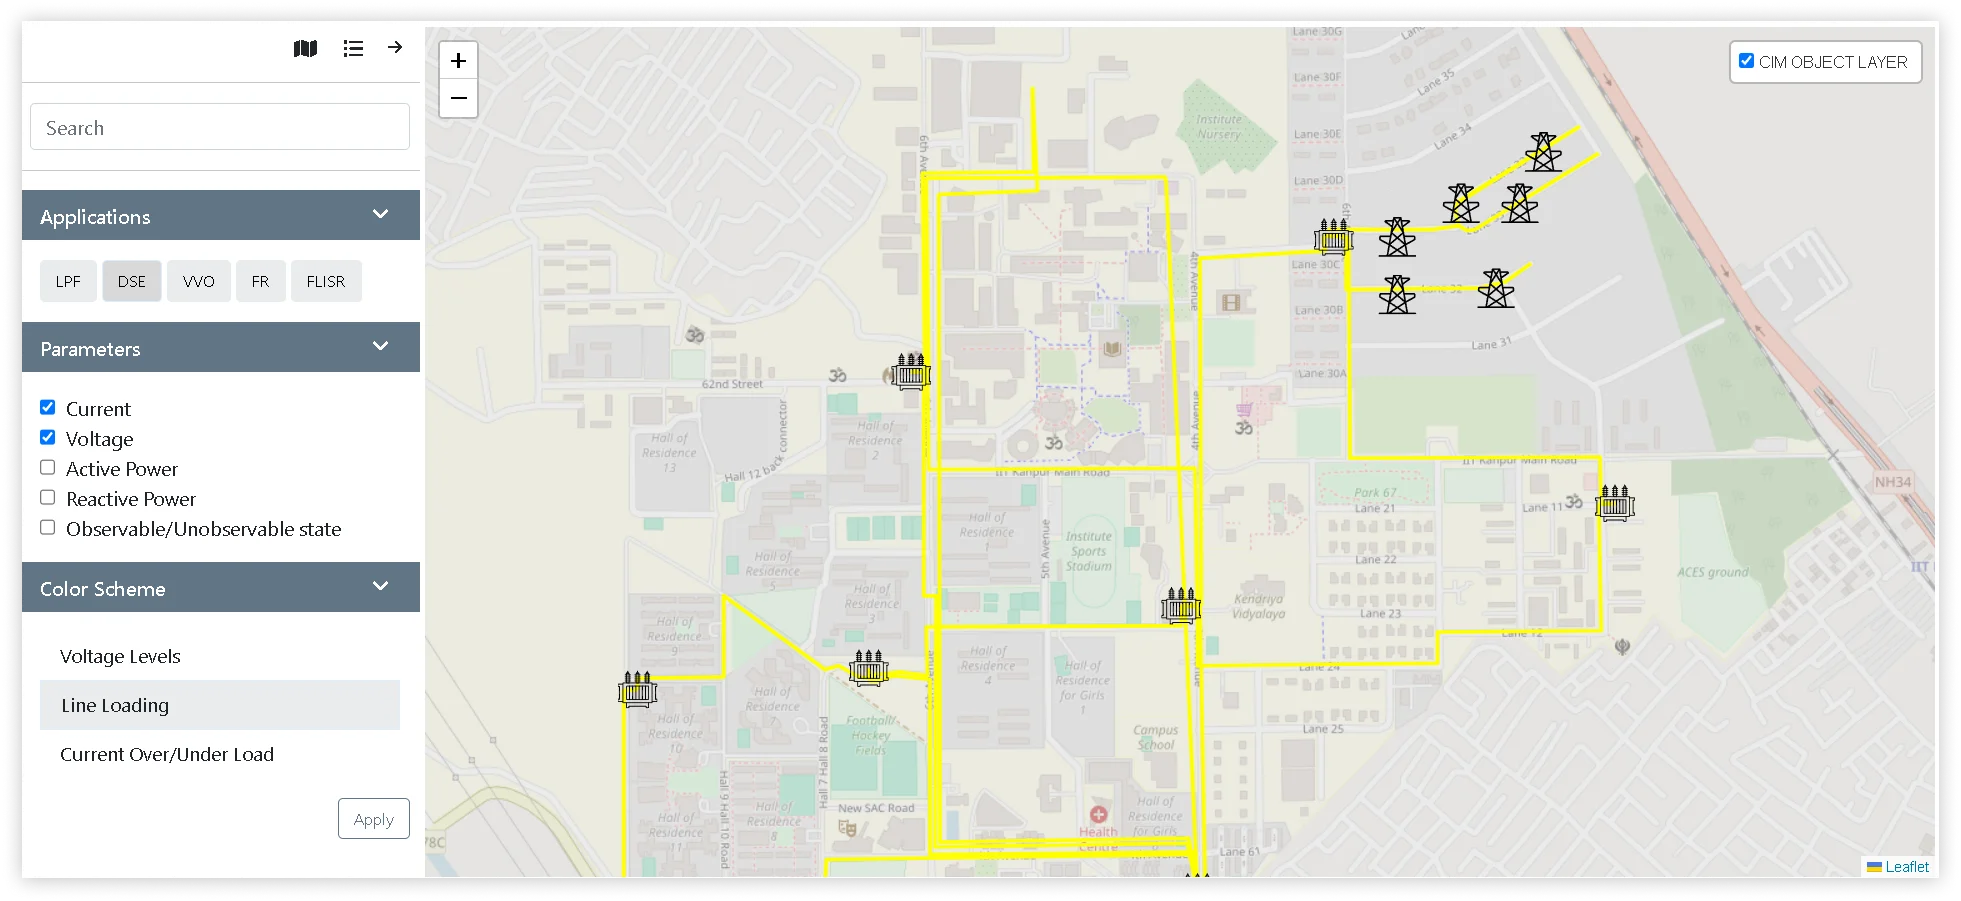
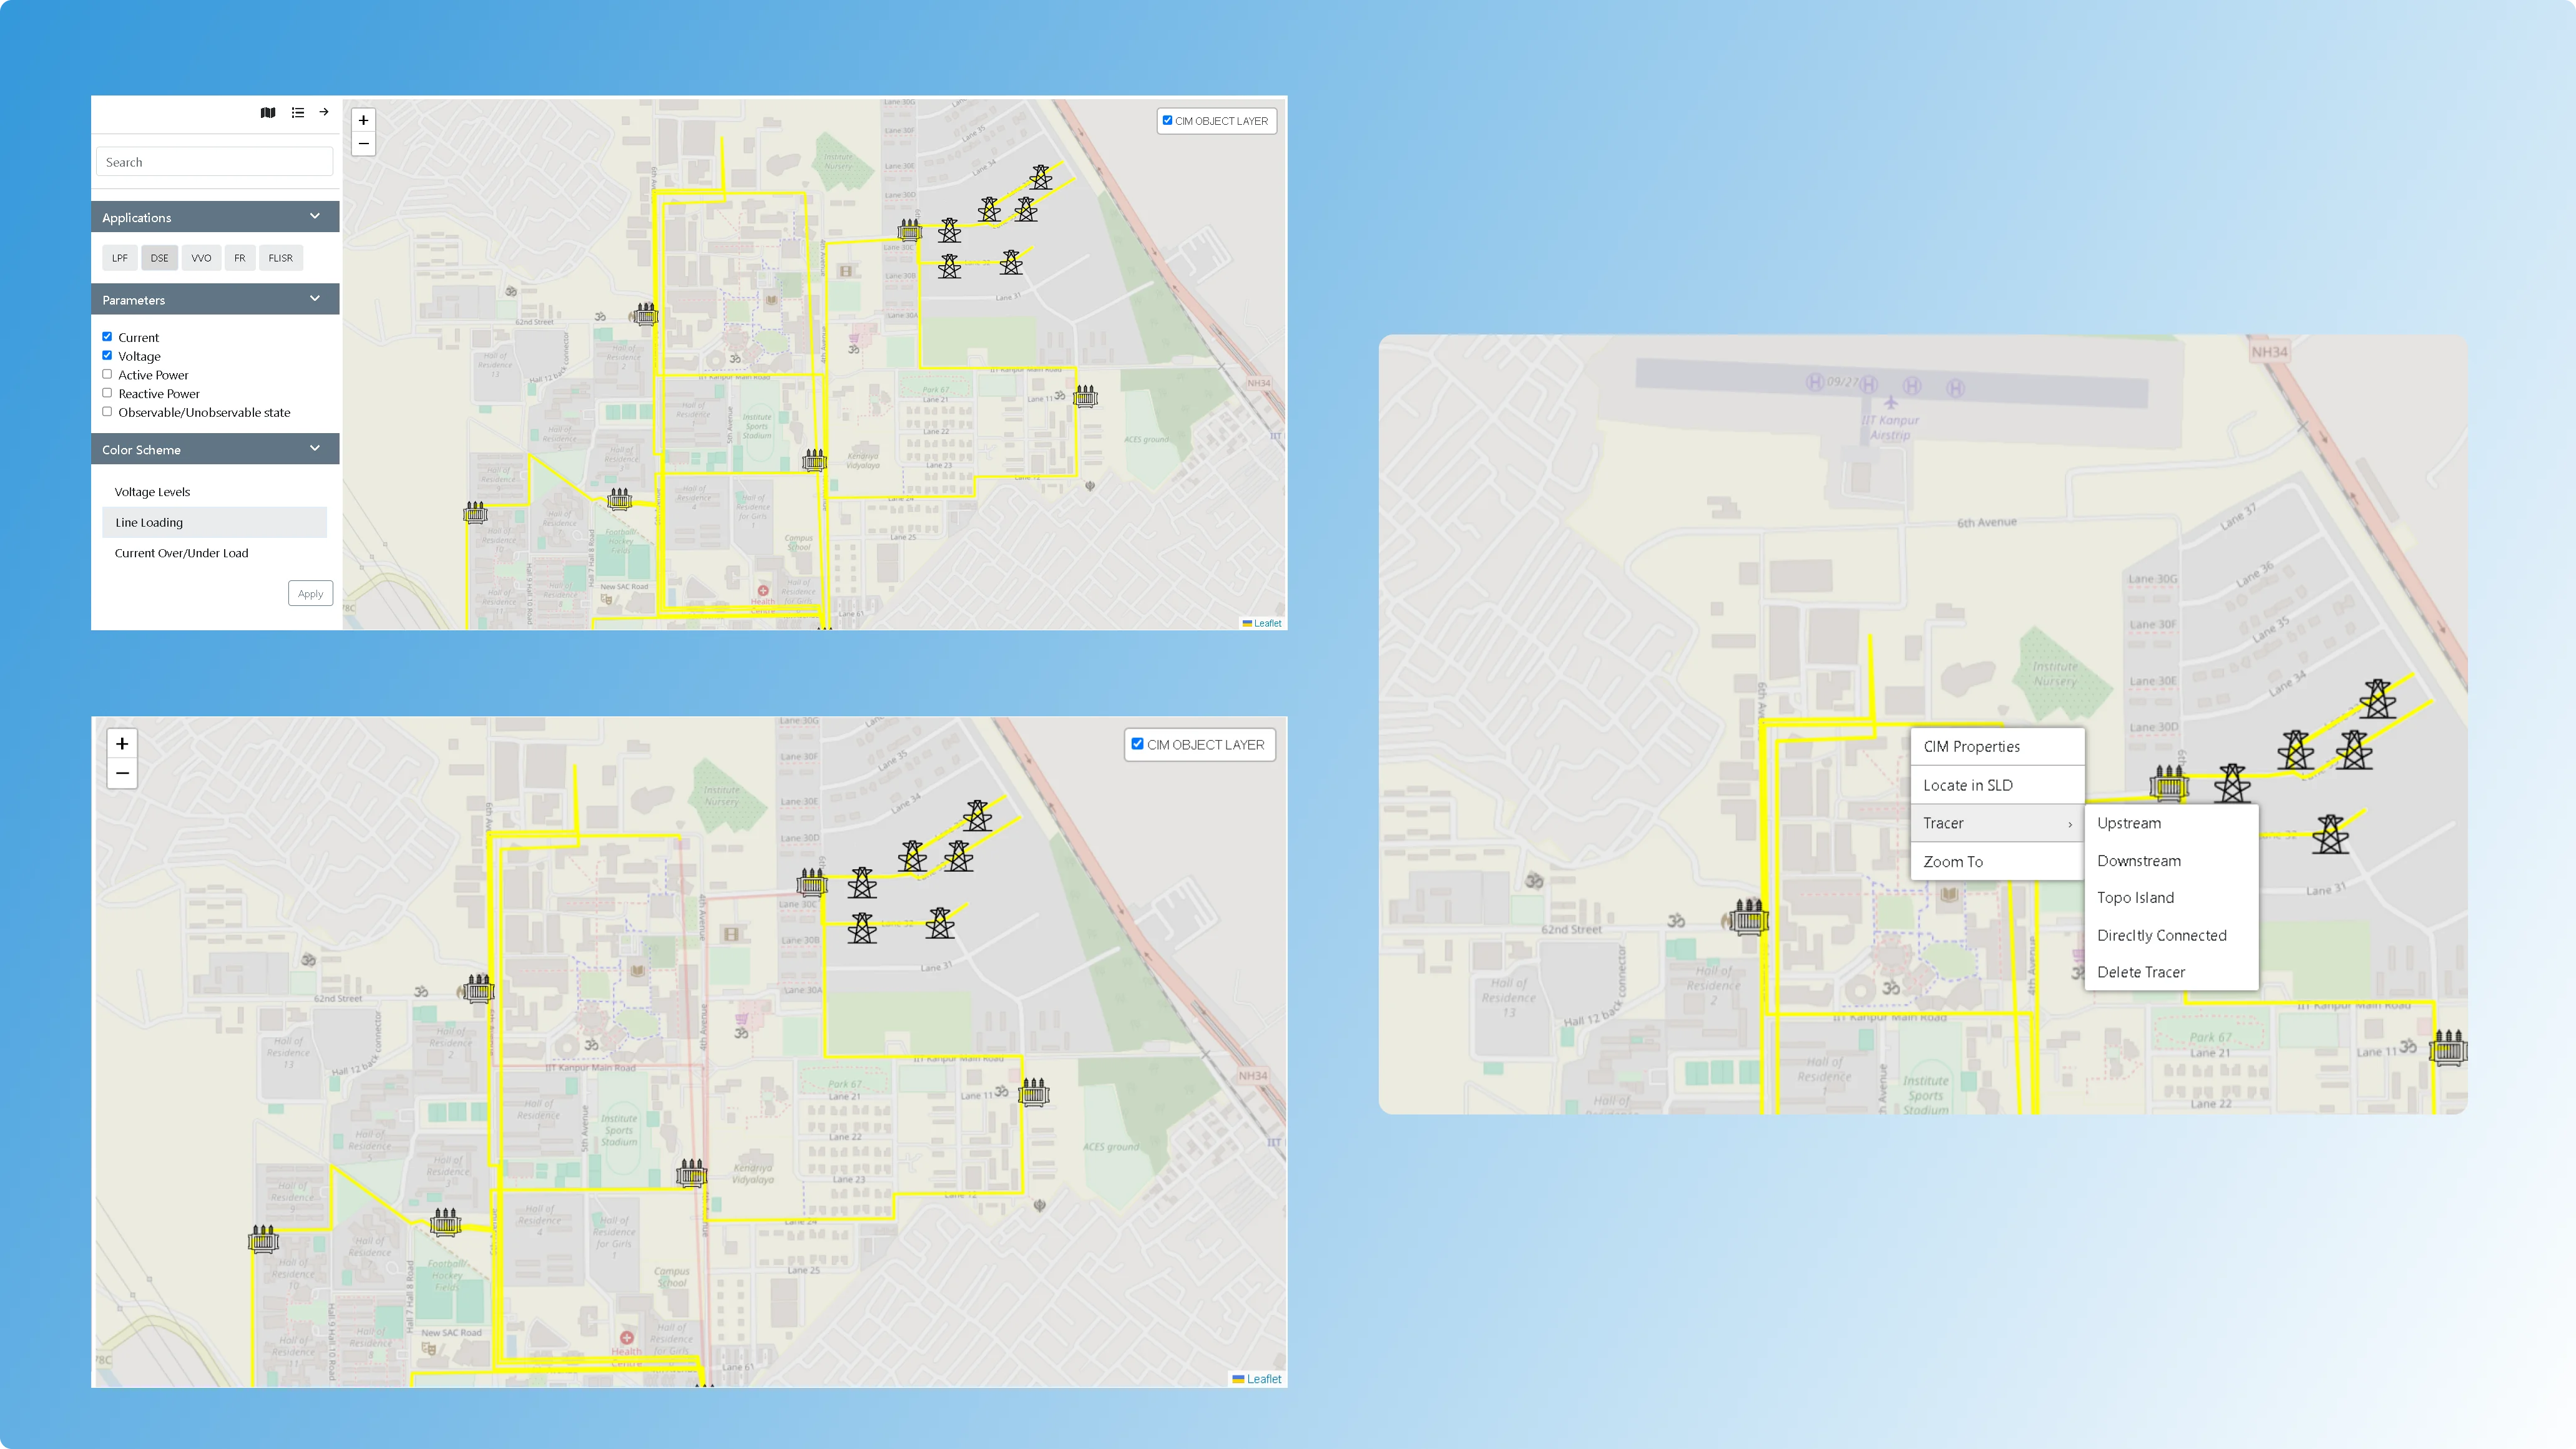
An Advanced Distribution Management System (ADMS) to visualize power transmission elements on an interactive map.

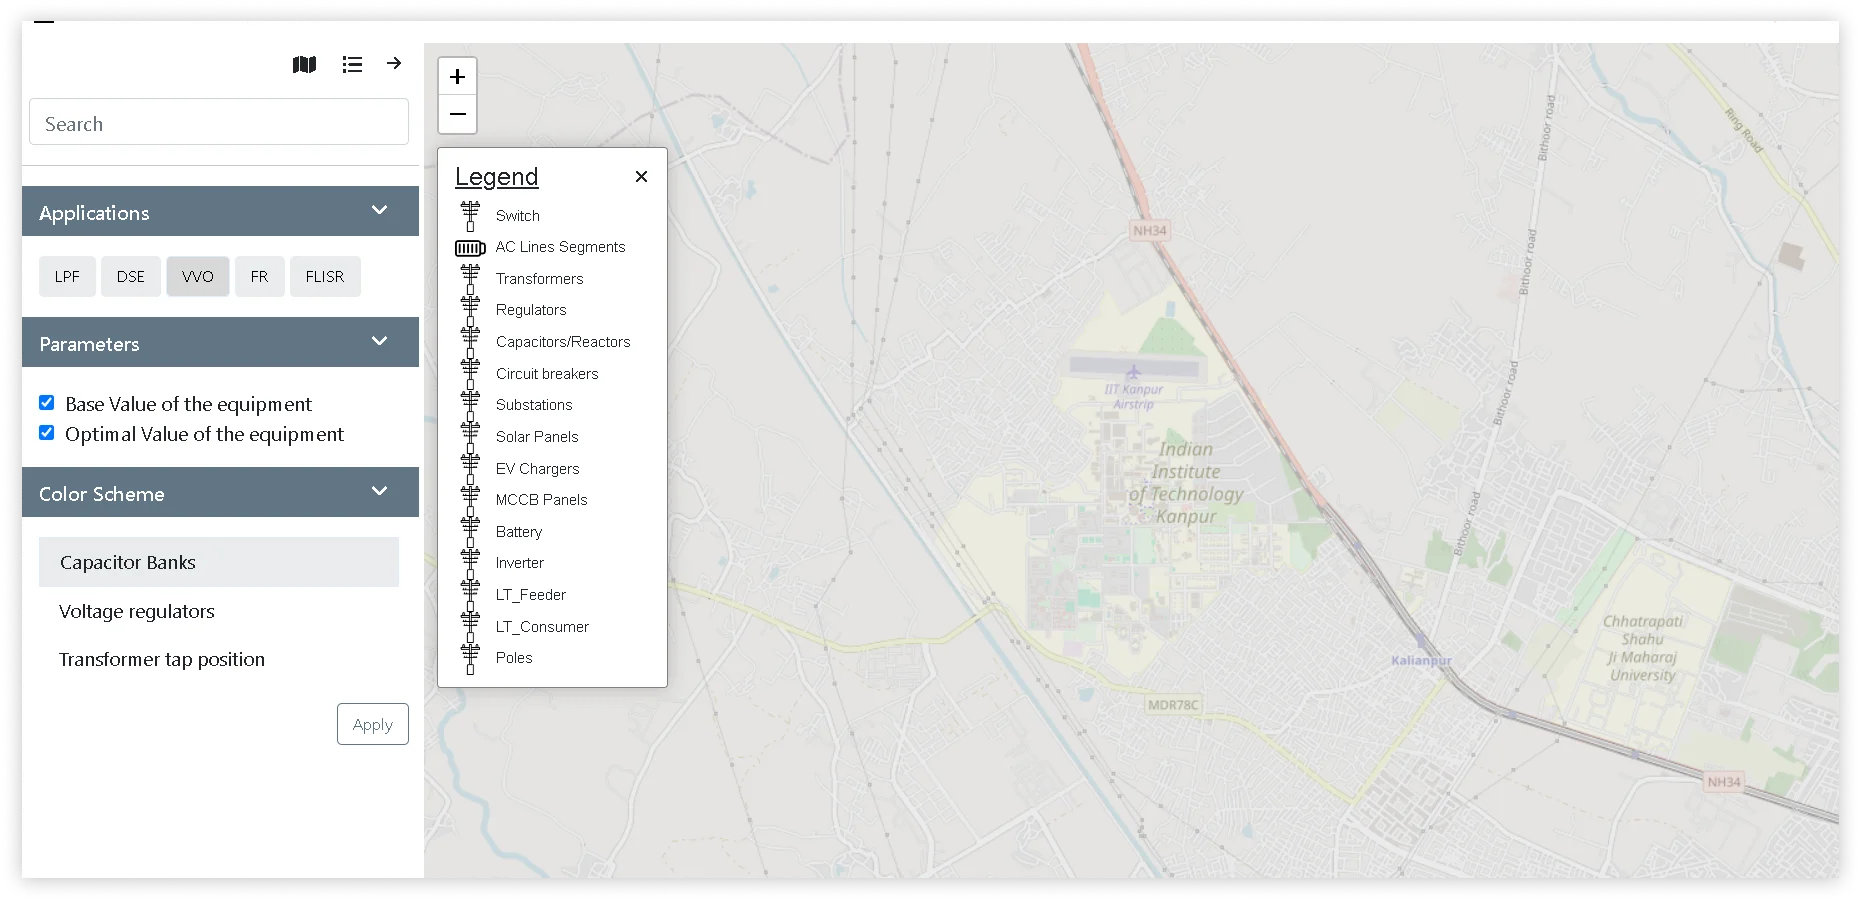


A client specializing in comprehensive power transmission solutions aimed to upgrade their system by incorporating a map-based user interface (UI). This new UI was designed to visually represent power transmission elements with real-time updates and layer grouping features, enhancing data management and providing a more intuitive user experience.
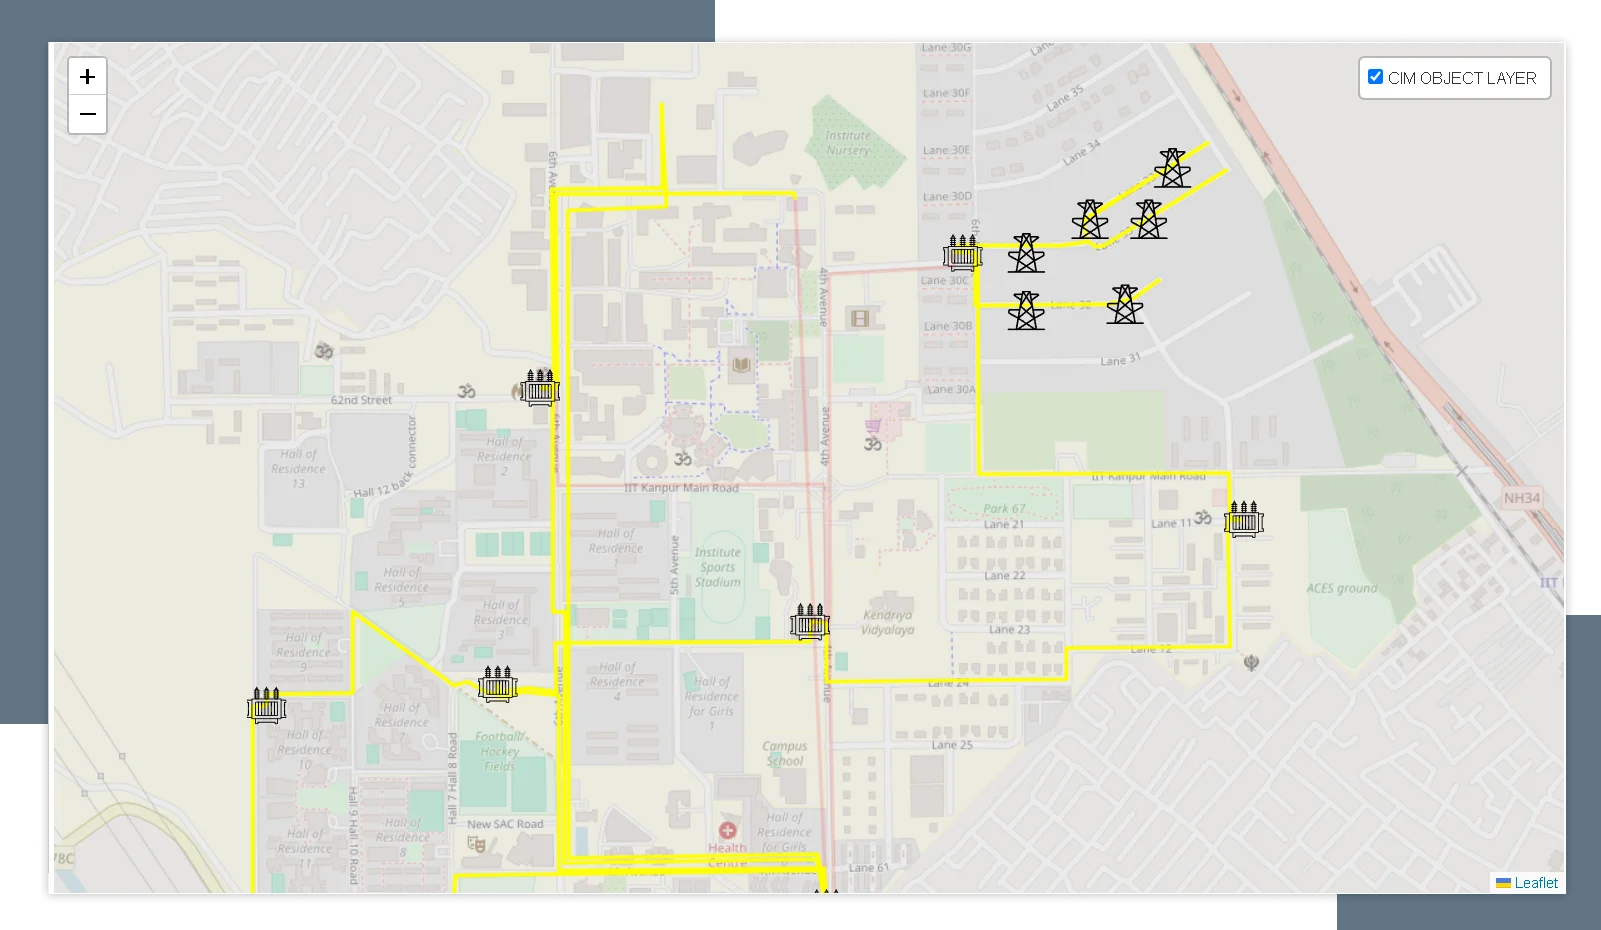
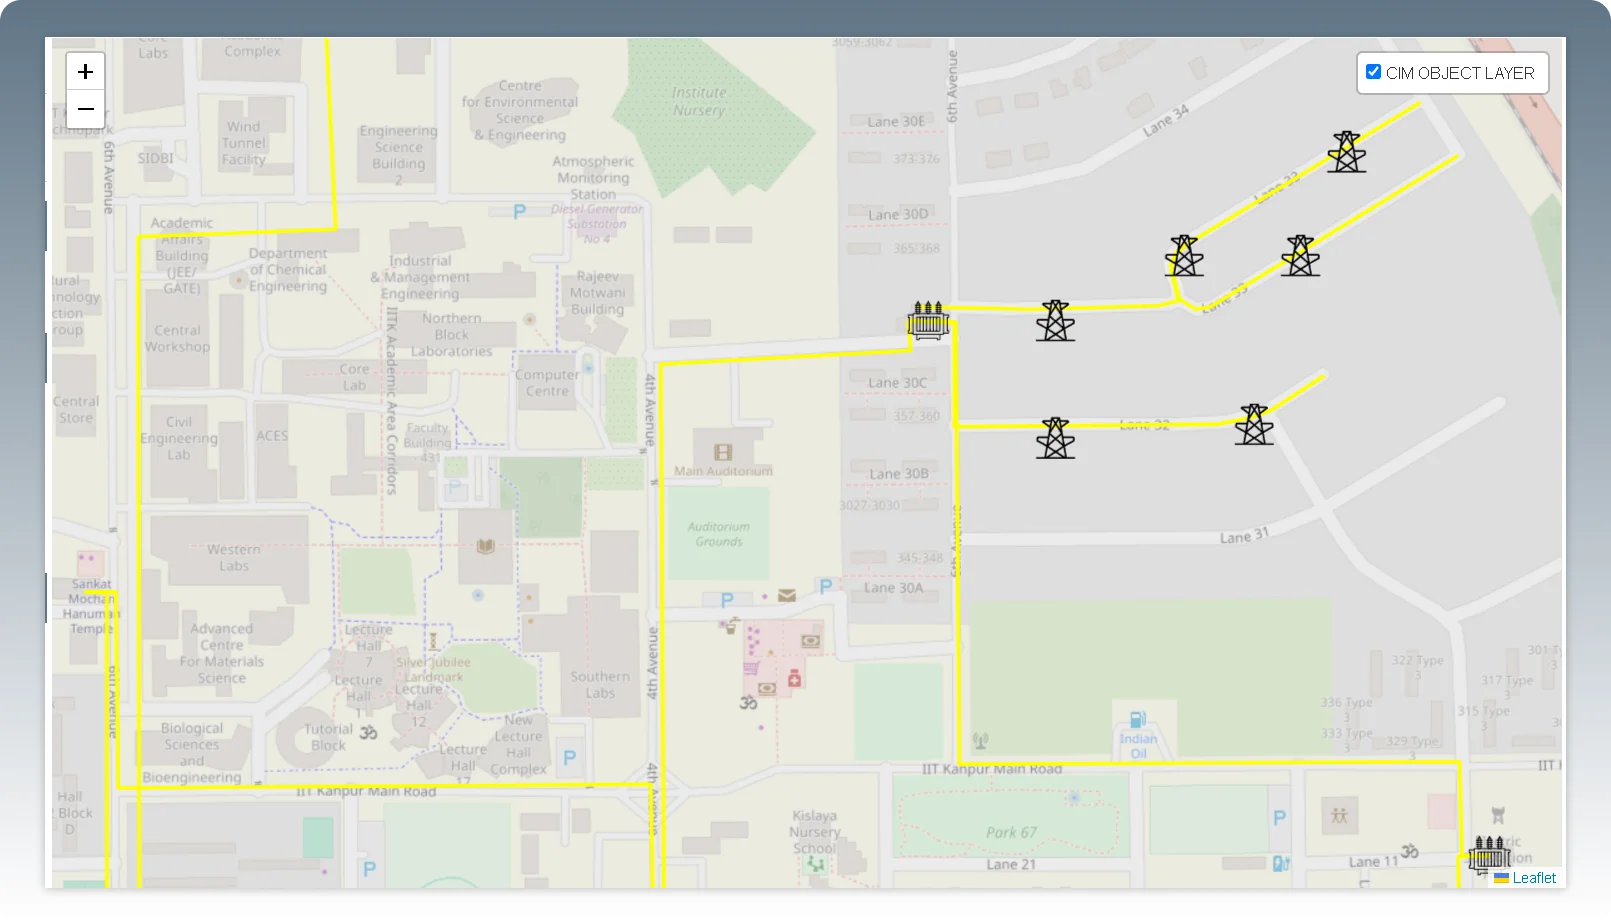
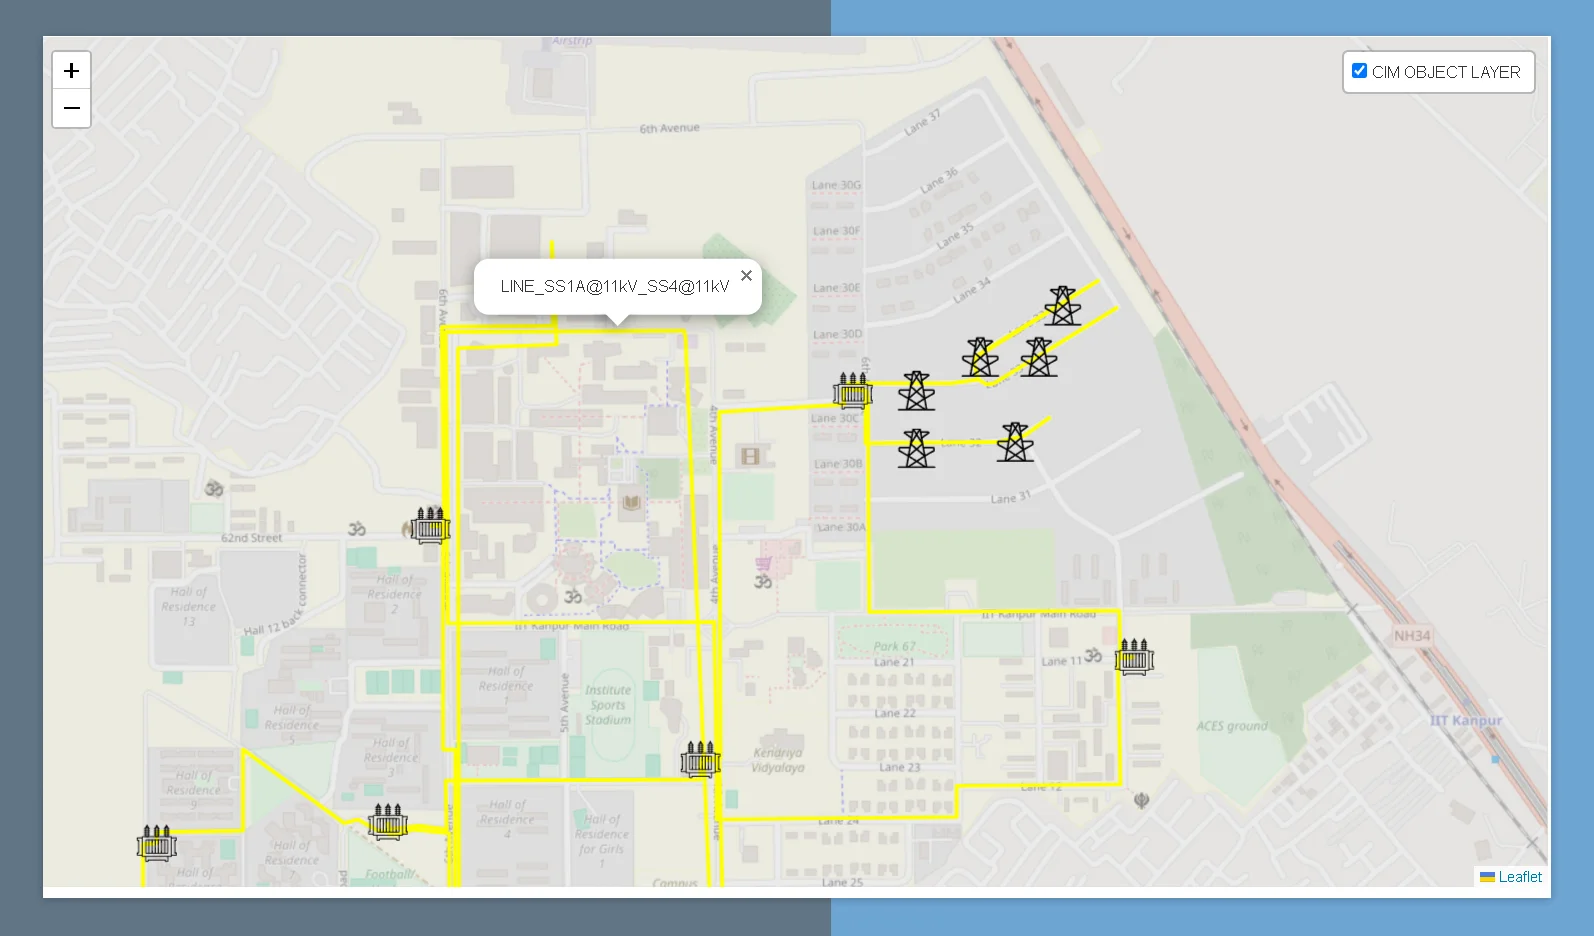
We developed an ADMS Map UI that allows users to view power transmission elements at specific locations with live updates on their properties. The solution ensures real-time notifications of any changes to the elements, enhancing operational efficiency and situational awareness.
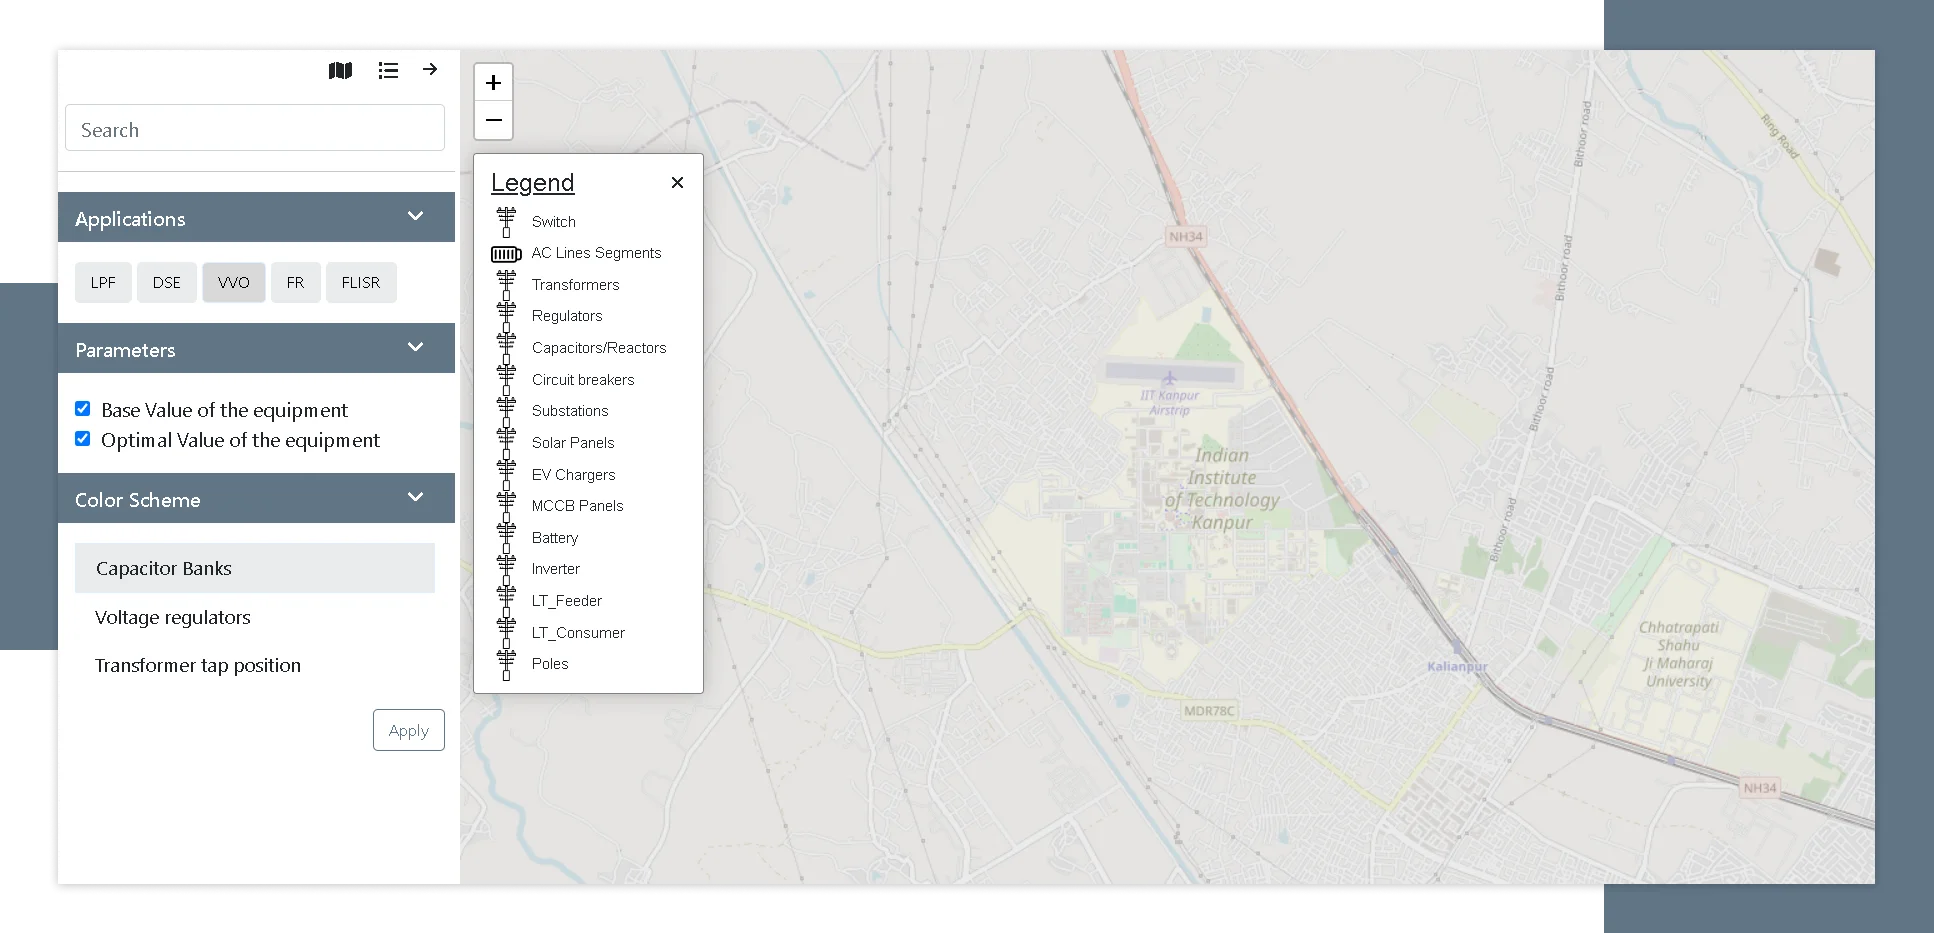
We developed an application that offers easy-to-use controls and customization options for interacting with the map.
Allows to switch between different views of the map, providing flexibility and better visualization according to their needs.
Helps quickly interpret map symbols and data, making it easier to understand and use the information.
Enables user to find specific elements on the map swiftly, improving efficiency in locating and managing key data points.
Provides access to various tools and features in one place, streamlining workflow and enhancing productivity.
Allows to easily adjust and apply different calculations, giving more control and precision in data analysis.
Offers the ability to customize the color display of different data types, making it simpler to visualize and interpret complex information.
Ensured that the map updated in real time based on the selections, providing immediate feedback and keeping data current for accurate decision-making.

I worked with TechAvidus for over 2 years. The team is incredible. They are very responsive, responsible, dedicated, and capable. I strongly recommend the team for any project, however complex.
Alexander Z Stanley
Business Development Manager
TechAvidus successfully delivered a user-friendly website, meeting the client's expectations. Their cost-efficiency, extensive experience, teamwork, timely delivery, excellent quality, sheer patience, and thoughtful attitude were hallmarks of their work.
Ralf Zieger

TechAvidus successfully completed the survey and dashboard with the requested requirements. The team was easy to work with, communicated effectively through weekly calls, and overcame language barriers. Their quality of work, professionalism, timely delivery, and budget-consciousness stood out.
Tamar Daniel
CMO
Keshu, Bhavesh and their team are outstanding. Not only were they able to build a very sophisticated and customized portal for our thousands of customers, but they did so with skill, efficiency, professionalism, and offered wonderful suggestions and recommendations along they way. Even more impressive, they were able to do all of this in spite of the convoluted direction we provided them with.
We've since expanded our relationship with them to cover many additional web development jobs. Choosing to work with TechAvidus was one of the best decisions we've made in recent years. We recommend them unconditionally.
Rob Price
President, Gatekeeper Press
"The vendor did an outstanding job. They paid attention to every detail of project scope and made prompt corrections when needed. I would definitely work with them again."
Jason Lorenti
Digital Development Manager at Evolved Office LLC
"TechAvidus transformed my social media presence! Their expertise in social media marketing & management propelled my business to new heights. The team's strategy, content creation, and engagement techniques were exceptional."
King Netsol Private Limited
Pintu Patel
"TechAvidus really helped us with our social media marketing! They made our services more popular online. They ran great campaigns that made our business grow a lot. We're so grateful for their help and hard work!"
Maurya Health Care
Dharra TrivediGet Recommendations, Custom Solutions, Developer’s Resume, or Estimations.
We would like to understand your needs. Before we start, please fill in the form or send your RFP or inquiry via hello@techavidus.com

In-House Experts
Years of Experience
Projects Delivered

Appreciative Reviews

Client Satisfaction Rate
IP-Related Complaints
Agile Development
Process

Countries Served
All Rights Reserved. Copyright © 2026 | TechAvidus